It just occurred to me that I haven’t blogged about SQLDeveloper yet, something I really need to change ;) This post covers SQLDeveloper 19.4, and although I don’t know exactly when the feature you are reading about was added I doubt it was in the latest release.
A little bit of background first
Sometimes the wait interface isn’t enough, so you need to dig a little deeper into the performance issue. In my opinion there are two layers inside Oracle when it comes to performance troubleshooting:
- The Wait Interface provides valuable insights about session activity, especially when off-CPU and waiting
- Session counters provide insights into ongoing operations at a lower level, and finer granularity
Tanel Poder’s post I linked to (yes, it’s from 2010, time flies!) provides an excellent introduction to the topic. His (session) snapper.sql script is one of my favourite and most heavily-used tools, especially when investigating an ongoing issue. Have a look at the Snapper landing page to get some more details and ideas about its many capabilities, it can do a LOT.
Adrian Billington’s mystats.sql tracks sessions counters as well, but it takes a different approach. The mystats.sql script works particularly well when you can sandwich a piece of (PL/)SQL between calls to mystats start and mystasts stop. I have been using it extensively for research and even managed to sneak a little improvement in ;)
Here is an example of mystat use. It captures session counters before and after the execution of a SQL statement and prints the delta. Have a look at the GitHub repository for more details about this very useful utility as I’m not going into the details…
SQL> @mystats start s=s
PL/SQL procedure successfully completed.
SELECT /*+ noparallel gather_plan_statistics */
2 oi.order_id,
SUM(oi.unit_price * oi.quantity)
4 FROM
5 soe.orders o,
6 soe.order_items oi
7 WHERE
8 o.order_id = oi.order_id
9 AND o.delivery_type = 'Express'
10 GROUP BY
11 oi.order_id
12 HAVING
SUM(oi.unit_price * oi.quantity) > 45000
14 ORDER BY
15 2 DESC;
ORDER_ID SUM(OI.UNIT_PRICE*OI.QUANTITY)
---------- ------------------------------
1449606 49324
577982 48606
468019 47970
1977685 46786
1891120 45347
2310221 45209
6 rows selected.
SQL> @mystats stop t=1
==========================================================================================
MyStats report : 26-MAY-2020 18:44:51
==========================================================================================
------------------------------------------------------------------------------------------
1. Summary Timings
------------------------------------------------------------------------------------------
Type Statistic Name Value
------ ---------------------------------------------------------------- ----------------
TIMER snapshot interval (seconds) 14.76
TIMER CPU time used (seconds) 2.38
------------------------------------------------------------------------------------------
2. Statistics Report
------------------------------------------------------------------------------------------
Type Statistic Name Value
------ ---------------------------------------------------------------- ----------------
STAT CPU used by this session 239
STAT CPU used when call started 238
STAT CR blocks created 13
STAT DB time 692
STAT Effective IO time 4,415,766
STAT Number of read IOs issued 1,336
STAT Requests to/from client 20
STAT SQL*Net roundtrips to/from client 20
STAT application wait time 9
STAT buffer is not pinned count 7
STAT bytes received via SQL*Net from client 20,586
STAT bytes sent via SQL*Net to client 10,594
STAT calls to get snapshot scn: kcmgss 791
STAT calls to kcmgcs 47
STAT cell physical IO interconnect bytes 1,370,603,520
STAT consistent changes 944
STAT consistent gets 278,437
STAT consistent gets direct 167,309
STAT consistent gets examination 251
STAT consistent gets examination (fastpath) 251
STAT consistent gets from cache 111,128
STAT consistent gets pin 110,877
STAT consistent gets pin (fastpath) 110,876
STAT data blocks consistent reads - undo records applied 247
STAT db block changes 838
STAT db block gets 2,415
STAT db block gets from cache 2,415
STAT db block gets from cache (fastpath) 1,970
STAT dirty buffers inspected 33
STAT enqueue conversions 4
STAT enqueue releases 8
STAT enqueue requests 8
STAT enqueue waits 1
STAT execute count 17
STAT execute count 17
STAT file io wait time 10,452,219
STAT free buffer inspected 105
STAT free buffer requested 69
STAT heap block compress 2
STAT hot buffers moved to head of LRU 193
STAT index fetch by key 2
STAT lob writes 391
STAT lob writes unaligned 391
STAT logical read bytes from cache 930,144,256
STAT no work - consistent read gets 277,738
STAT non-idle wait count 1,153
STAT non-idle wait time 452
STAT opened cursors cumulative 21
STAT parse count (hard) 1
STAT parse count (total) 17
STAT physical read IO requests 1,337
STAT physical read bytes 1,370,603,520
STAT physical read total IO requests 1,337
STAT physical read total bytes 1,370,603,520
STAT physical read total multi block requests 1,336
STAT physical reads 167,310
STAT physical reads cache 1
STAT physical reads direct 167,309
STAT process last non-idle time 15
STAT recursive calls 2,022
STAT recursive cpu usage 3
STAT rollbacks only - consistent read gets 26
STAT rows fetched via callback 1
STAT session cursor cache count 7
STAT session cursor cache hits 10
STAT session logical reads 280,852
STAT session pga memory 2,276,704
STAT session pga memory max 65,518,944
STAT session uga memory 261,952
STAT session uga memory max 63,036,496
STAT sorts (memory) 1
STAT sorts (rows) 6
STAT table fetch by rowid 1
STAT table scan blocks gotten 277,764
STAT table scan disk non-IMC rows gotten 31,341,195
STAT table scan rows gotten 31,341,195
STAT table scans (direct read) 1
STAT table scans (long tables) 2
STAT temp space allocated (bytes) 1,048,576
STAT user I/O wait time 442
STAT user calls 28
STAT workarea executions - optimal 6
STAT workarea memory allocated 12
------------------------------------------------------------------------------------------
3. Options Used
------------------------------------------------------------------------------------------
- Statistics types : s=s
- Reporting filter : t=1
------------------------------------------------------------------------------------------
4. About
------------------------------------------------------------------------------------------
- MyStats v3.0 by Adrian Billington (http://www.oracle-developer.net)
- Original version based on the SNAP_MY_STATS utility by Jonathan Lewis
==========================================================================================
End of report
==========================================================================================
PL/SQL procedure successfully completed.
I have modified mystats slightly so as to sort output by statistic name, rather than the change in value. I find it easier to read that way, but your mileage may vary.
Each time I look at performance instrumentation in the Oracle database I am pleasantly surprised about the level of detail available. I haven’t blogged about it lately, but going back a bit to 12.2 shows the progress made. And Oracle didn’t stop there, either. Using mystats’s output I can derive all sorts of interesting facts, none of which are of importance for this post as I’m purely interesting in reporting the change in session stats ;) When researching how Oracle works, this is quite a wealth of information, and you can find further examples on this blog.
SQLDeveloper can do this, too
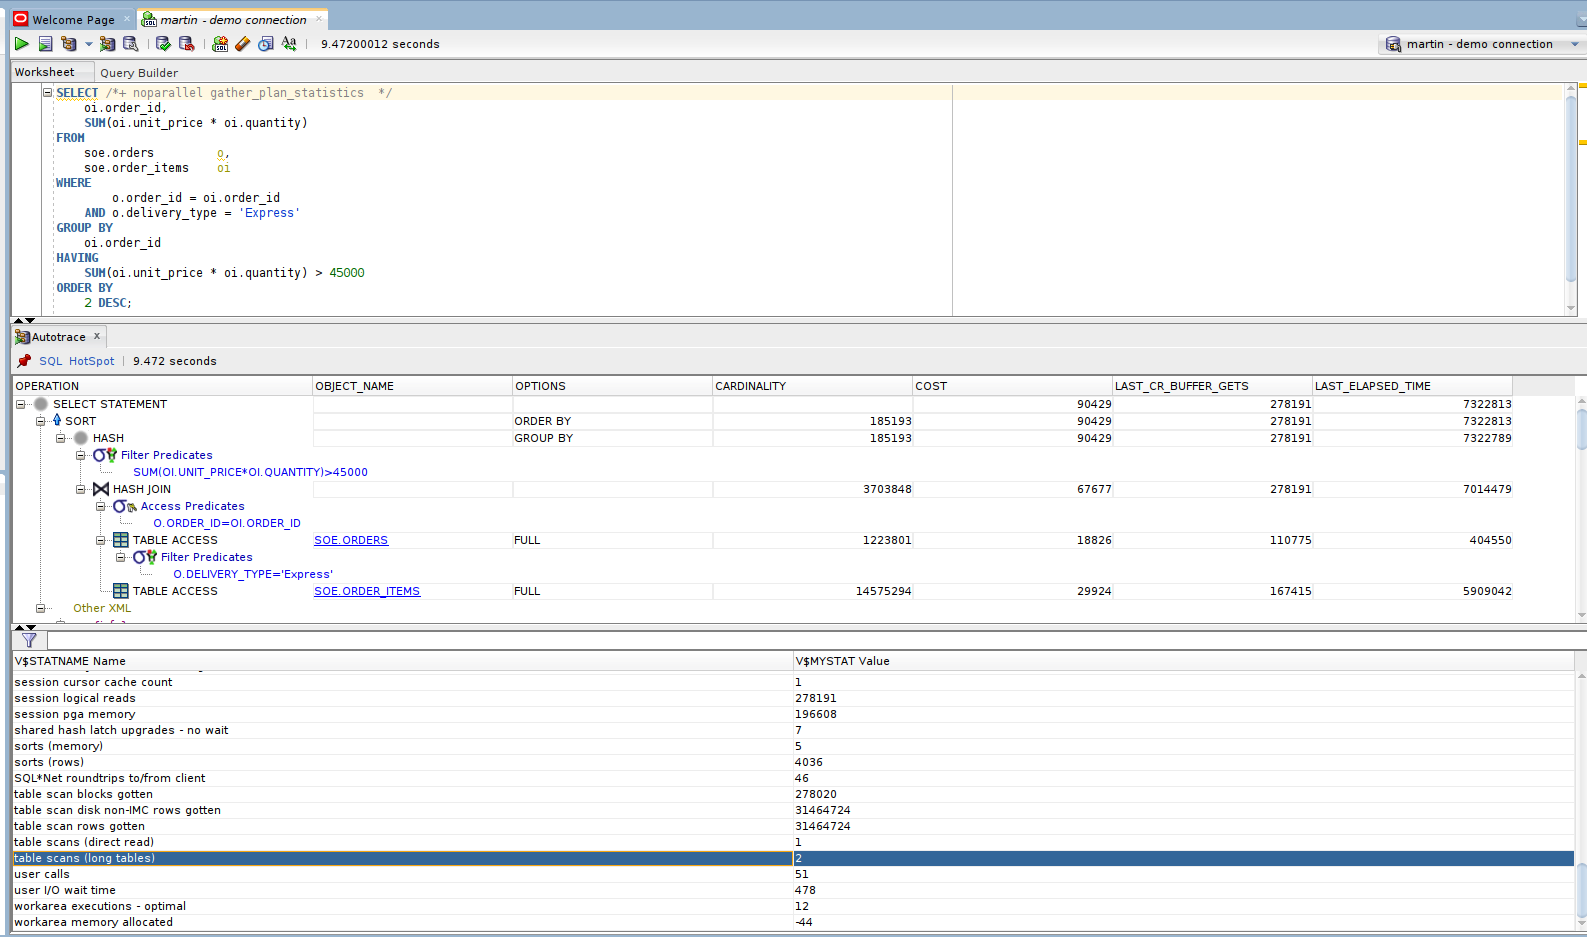
If you are using SQLDeveloper and don’t want/need to use the command line, you can get something quite similar as well. Just enter your query into the text window, then hit F6 for “Autotrace”. In the lower part of your Autotrace results, you can see the change in session counters. If not, you may have to swipe the statistics pane into view using the mouse. Figure 1 shows an example:
Summary
Session counters are super useful for understanding what Oracle does at a more granular level than the wait interface. For the most part, using the wait interface is enough, yet there is the occasional case where more details are needed. I often consider changes in session statistics when researching a particular problem, and thankfully I don’t have to come up with ways to do so as the community has already lent a helping hand!

You must be logged in to post a comment.