While preparing for another blog post I desperately wanted to write I noticed something unexpected. The problem turned out to be between keyboard and chair, but I don’t want to get ahead of myself.
Tell me what happened already!
Using Oracle SQL Developer Extension for Visual Studio Code, connecting to an Autonomous Database-Serverless, a query against my Swingbench Order Entry (SOE) schema ran in parallel. Which is odd, OrderEntry is an OLTP style schema/benchmark, and parallelism is most definitely unwanted in these…. I’ll take you along on a non-AI aided, self-written investigation into the problem and how I eventually solved it.
The solution is rather simple, but still worth knowing. Hopefully this post saves you 5 minutes scratching your head!
Background
I cloned an existing connection in SQLDev for VSCode, changed username and password and connected against the database. So far, so good. The particular query, shown here with its execution plan, runs in parallel as you can see with all these PX steps and the PQ Distribution column in the execution plan:
SQL> select
  2      *
  3  from
  4*     table(dbms_xplan.display_cursor(sql_id => '8hyqhnjzg5kv8', cursor_child_no => 1))
SQL> /

PLAN_TABLE_OUTPUT
__________________________________________________________________________________________________________________________________________________________
SQL_ID  8hyqhnjzg5kv8, child number 1
-------------------------------------
select /*+ gather_plan_statistics monitor */     c.customer_id,
c.cust_first_name     || ' '     || c.cust_last_name as customer_name,
   o.order_id,     o.order_date,     o.order_total,
oi.line_item_id,     p.product_name,     oi.quantity,
oi.unit_price,     ( oi.quantity * oi.unit_price ) as line_total from
  customers c     inner join orders o on c.customer_id = o.customer_id
   inner join order_items oi on o.order_id = oi.order_id     inner join
product_information p on oi.product_id = p.product_id where
c.account_mgr_id = 146 order by     o.order_date desc,     c.customer_id

Plan hash value: 4155957470

-------------------------------------------------------------------------------------------------------------------------------------------------------
| Id  | Operation                                      | Name                    | Rows  | Bytes | Cost (%CPU)| Time     |    TQ  |IN-OUT| PQ Distrib |
-------------------------------------------------------------------------------------------------------------------------------------------------------
|   0 | SELECT STATEMENT                               |                         |       |       |  1322 (100)|          |        |      |            |
|   1 |  PX COORDINATOR                                |                         |       |       |            |          |        |      |            |
|   2 |   PX SEND QC (ORDER)                           | :TQ10004                |  1866 |   180K|  1322   (1)| 00:00:01 |  Q1,04 | P->S | QC (ORDER) |
|   3 |    SORT ORDER BY                               |                         |  1866 |   180K|  1322   (1)| 00:00:01 |  Q1,04 | PCWP |            |
|   4 |     PX RECEIVE                                 |                         |  1866 |   180K|  1321   (0)| 00:00:01 |  Q1,04 | PCWP |            |
|   5 |      PX SEND RANGE                             | :TQ10003                |  1866 |   180K|  1321   (0)| 00:00:01 |  Q1,03 | P->P | RANGE      |
|*  6 |       HASH JOIN BUFFERED                       |                         |  1866 |   180K|  1321   (0)| 00:00:01 |  Q1,03 | PCWP |            |
|   7 |        TABLE ACCESS FULL                       | PRODUCT_INFORMATION     |  1000 | 27000 |     5   (0)| 00:00:01 |  Q1,03 | PCWP |            |
|   8 |        NESTED LOOPS                            |                         |  1879 |   132K|  1316   (0)| 00:00:01 |  Q1,03 | PCWP |            |
|   9 |         NESTED LOOPS                           |                         |  1879 |   132K|  1316   (0)| 00:00:01 |  Q1,03 | PCWP |            |
|* 10 |          HASH JOIN                             |                         |   366 | 19032 |   503   (0)| 00:00:01 |  Q1,03 | PCWP |            |
|  11 |           PX RECEIVE                           |                         |       |       |            |          |  Q1,03 | PCWP |            |
|  12 |            PX SEND HASH                        | :TQ10001                |       |       |            |          |  Q1,01 | P->P | HASH       |
|  13 |             TABLE ACCESS BY INDEX ROWID BATCHED| CUSTOMERS               |   194 |  4850 |   120   (0)| 00:00:01 |  Q1,01 | PCWP |            |
|  14 |              BUFFER SORT                       |                         |       |       |            |          |  Q1,01 | PCWC |            |
|  15 |               PX RECEIVE                       |                         |   124 |       |     3   (0)| 00:00:01 |  Q1,01 | PCWP |            |
|  16 |                PX SEND HASH (BLOCK ADDRESS)    | :TQ10000                |   124 |       |     3   (0)| 00:00:01 |  Q1,00 | S->P | HASH (BLOCK|
|  17 |                 PX SELECTOR                    |                         |       |       |            |          |  Q1,00 | SCWC |            |
|* 18 |                  INDEX RANGE SCAN              | CUST_ACCOUNT_MANAGER_IX |   124 |       |     3   (0)| 00:00:01 |  Q1,00 | SCWP |            |
|  19 |           PX RECEIVE                           |                         |     2 |    54 |     2   (0)| 00:00:01 |  Q1,03 | PCWP |            |
|  20 |            PX SEND HASH                        | :TQ10002                |     2 |    54 |     2   (0)| 00:00:01 |  Q1,02 | P->P | HASH       |
|  21 |             PX BLOCK ITERATOR                  |                         |     2 |    54 |     2   (0)| 00:00:01 |  Q1,02 | PCWC |            |
|* 22 |              TABLE ACCESS FULL                 | ORDERS                  |     2 |    54 |     2   (0)| 00:00:01 |  Q1,02 | PCWP |            |
|* 23 |          INDEX RANGE SCAN                      | ITEM_ORDER_IX           |     5 |       |     1   (0)| 00:00:01 |  Q1,03 | PCWP |            |
|  24 |         TABLE ACCESS BY INDEX ROWID            | ORDER_ITEMS             |     5 |   100 |     2   (0)| 00:00:01 |  Q1,03 | PCWP |            |
-------------------------------------------------------------------------------------------------------------------------------------------------------

Predicate Information (identified by operation id):
---------------------------------------------------

   6 - access("OI"."PRODUCT_ID"="P"."PRODUCT_ID")
  10 - access("C"."CUSTOMER_ID"="O"."CUSTOMER_ID")
  18 - access("C"."ACCOUNT_MGR_ID"=146)
  22 - access(:Z>=:Z AND :Z<=:Z)
  23 - access("O"."ORDER_ID"="OI"."ORDER_ID")

Note
-----
   - dynamic statistics used: dynamic sampling (level=AUTO (SYSTEM))
   - automatic DOP: Computed Degree of Parallelism is 2
   - this is an adaptive plan


59 rows selected.
Right, ok, time to enter troubleshooting mode.
Troubleshooting
Often, when queries start running in parallel, one of the segments touched has a degree of parallelism (DOP) set to <> 1. This sounds like a logical cause for the parallel execution; I previously ran sbutil (part of the Swingbench toolchest), inflating the benchmark data volume by a factor of two. The run aborted due to a network issue, and it left all the indexes with a DOP of 4. Easy to fix! Just alter index soe.theIndexName noparallel and you’re done.
Did that, then ran the query again … no change in behaviour 🤔. Right, ok, more thinking required.
This is a playground environment I use for writing blog posts, so a little blunt force is in order – let’s go ahead and purge the cursor from the shared pool: I want to force a fresh parse. Using the flush.sql script from my script repository, I got rid of the cursor:
SQL> SELECT
  2      child_number,
  3      plan_hash_value,
  4      invalidations,
  5      executions
  6  FROM
  7      v$sql
  8  WHERE
  9      sql_id = '8hyqhnjzg5kv8';

no rows selected
Still, no change, the query continued to run in parallel.
The solution
I could have passed a /*+ noparallel */ hint to the query (which solves my problem), but that requires additional TLC moving forwards. Hints are always tricky business, for reasons outlined by people way smarter than me. Suffice to say I didn’t want to use any.
I still had to understand why the query executes in parallel. After a little time it dawned on me: depending on how you connect to an Autonomous Database instance, different degrees of parallelism are defined, tied to the service name. And sure enough, I connected to one of the PX-enabled services: databaseName_high.

databaseName_high is one of the predefined service names in Autonomous Database, and that’s a pretty awesome concept. Here’s the table containing the details about PX and concurrency with predefined service names in Autonomous Database-Serverless. It might get out of date over time, so make sure you check the source.
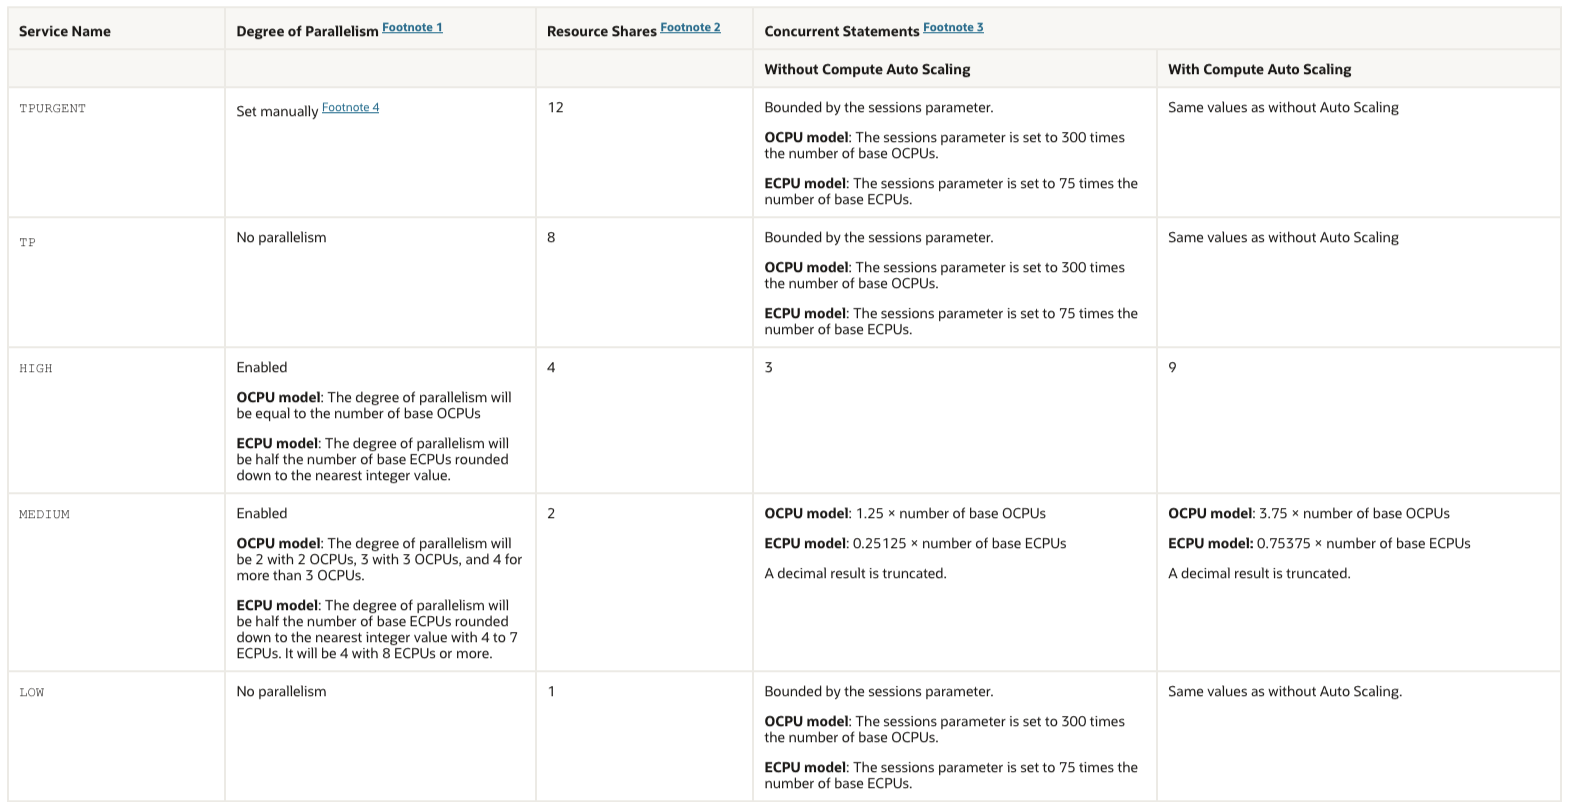
As you can see, PX is enabled for the “high” service name, and that’s why my query executed in parallel.
With that information at hand, solving the mystery is a doddle. Change the connection information, and connect to the databaseName_TP service, or, as an alternative, databaseName_low. I went for blogpost_low, reconnected, and sure enough, things start to look like what I expected them to:
SQL> select /*+ gather_plan_statistics monitor */
  2      c.customer_id,
  3      c.cust_first_name
  4      || ' '
  5      || c.cust_last_name as customer_name,
  6      o.order_id,
  7      o.order_date,
  8      o.order_total,
  9      oi.line_item_id,
 10      p.product_name,
 11      oi.quantity,
 12      oi.unit_price,
 13      ( oi.quantity * oi.unit_price ) as line_total
 14  from
 15      customers c
 16      inner join orders o on c.customer_id = o.customer_id
 17      inner join order_items oi on o.order_id = oi.order_id
 18      inner join product_information p on oi.product_id = p.product_id
 19  where
 20      c.account_mgr_id = 146
 21  order by
 22      o.order_date desc,
 23*     c.customer_id;

   CUSTOMER_ID CUSTOMER_NAME             ORDER_ID ORDER_DATE                        ORDER_TOTAL    LINE_ITEM_ID PRODUCT_NAME                             QUANTITY    UNIT_PRICE    LINE_TOTAL
______________ ______________________ ___________ ______________________________ ______________ _______________ _____________________________________ ___________ _____________ _____________
        253648 terry nguyen               2078576 15.04.12 09:40:16,384000000              4774               3 iPkH7g23hN2MFrYUeF8AHtXk6E2QJ C                 5          1070          5350

...

SQL> select * from table(dbms_xplan.display_cursor);

PLAN_TABLE_OUTPUT
_______________________________________________________________________________________________________________________________
SQL_ID  8hyqhnjzg5kv8, child number 0
-------------------------------------
select /*+ gather_plan_statistics monitor */     c.customer_id,
c.cust_first_name     || ' '     || c.cust_last_name as customer_name,
   o.order_id,     o.order_date,     o.order_total,
oi.line_item_id,     p.product_name,     oi.quantity,
oi.unit_price,     ( oi.quantity * oi.unit_price ) as line_total from
  customers c     inner join orders o on c.customer_id = o.customer_id
   inner join order_items oi on o.order_id = oi.order_id     inner join
product_information p on oi.product_id = p.product_id where
c.account_mgr_id = 146 order by     o.order_date desc,     c.customer_id

Plan hash value: 1043292108

----------------------------------------------------------------------------------------------------------------------------
| Id  | Operation                                | Name                    | Rows  | Bytes |TempSpc| Cost (%CPU)| Time     |
----------------------------------------------------------------------------------------------------------------------------
|   0 | SELECT STATEMENT                         |                         |       |       |       | 44969 (100)|          |
|   1 |  SORT ORDER BY                           |                         | 35297 |  3412K|  3776K| 44969   (1)| 00:00:02 |
|*  2 |   HASH JOIN                              |                         | 35297 |  3412K|       | 44172   (1)| 00:00:02 |
|   3 |    TABLE ACCESS FULL                     | PRODUCT_INFORMATION     |  1000 | 27000 |       |     9   (0)| 00:00:01 |
|   4 |    NESTED LOOPS                          |                         | 35544 |  2499K|       | 44163   (1)| 00:00:02 |
|   5 |     NESTED LOOPS                         |                         | 35544 |  2499K|       | 44163   (1)| 00:00:02 |
|   6 |      NESTED LOOPS                        |                         |  6918 |   351K|       | 16484   (1)| 00:00:01 |
|   7 |       TABLE ACCESS BY INDEX ROWID BATCHED| CUSTOMERS               |  3669 | 91725 |       |  3456   (1)| 00:00:01 |
|*  8 |        INDEX RANGE SCAN                  | CUST_ACCOUNT_MANAGER_IX |  3669 |       |       |    11   (0)| 00:00:01 |
|   9 |       TABLE ACCESS BY INDEX ROWID BATCHED| ORDERS                  |     2 |    54 |       |     4   (0)| 00:00:01 |
|* 10 |        INDEX RANGE SCAN                  | ORD_CUSTOMER_IX         |     2 |       |       |     2   (0)| 00:00:01 |
|* 11 |      INDEX RANGE SCAN                    | ITEM_ORDER_IX           |     5 |       |       |     2   (0)| 00:00:01 |
|  12 |     TABLE ACCESS BY INDEX ROWID          | ORDER_ITEMS             |     5 |   100 |       |     4   (0)| 00:00:01 |
----------------------------------------------------------------------------------------------------------------------------

Predicate Information (identified by operation id):
---------------------------------------------------

   2 - access("OI"."PRODUCT_ID"="P"."PRODUCT_ID")
   8 - access("C"."ACCOUNT_MGR_ID"=146)
  10 - access("C"."CUSTOMER_ID"="O"."CUSTOMER_ID")
  11 - access("O"."ORDER_ID"="OI"."ORDER_ID")

Note
-----
   - this is an adaptive plan


44 rows selected
That really is all there is to be said
Summary
Oracle Autonomous Database is very cleverly engineered, and it adheres to some of the industry’s best practices when it comes to workload management. I have previously tied resource consumer groups to services, and enabled/disabled PX along with other resource management limits suitable for consolidating large numbers of databases on Exadata. The nice thing is that I don’t have to do that with an Autonomous Database. Oracle did it for me, and they have been doing for quite some time.
The only thing you need to be aware of are the service names available to your users. Assign them according to their roles, and you won’t see surprises like I did.

You must be logged in to post a comment.